The one device which is more prominent in this digital industry is Spectrum Analyzer. This device holds a nearly 50-year history which consists of surmounting multiple complications in introducing the product to the real-time market. The development of the device initially took place at Applied Research Laboratories of Columbia University. The first developed spectrum uses glass acoustic delay lines, and it delivers real-time processing in the range of 1 – 40 kHz. And the initial development spectrum analyzers took place in the year 1960s which were swept-tuned devices. Upon the discovery of the Fourier Transform, the first Fourier Transform analyzers were introduced in the year 1967. With this initiation, today we have many kinds of analyzers. So, today this article explains what a spectrum analyzer is, how it works, its types, and its uses.
What is Spectrum Analyzer?
A spectrum analyzer is a device that is employed for assessing the signal’s amplitude relating to its frequency. So, the input signal which is provided for the analyzer is assessed depending on different frequency levels. This kind of assessment is mainly helpful for testing, handling RF circuitry, and in designing.
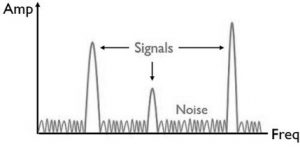
The graph for this device is plotted against the amplitude of the signal corresponding to its frequency. Here, the amplitude is plotted on the vertical axis in the logarithmic scale, and frequency is plotted on the x-axis either on a normal or logarithmic scale. Plotting amplitude on the y-axis in the logarithmic scale allows analyzing huge variations in the amplitude levels of multiple signals.
One might be uncertain that what is the variation between the oscilloscope and spectrum analyzer. So, an oscilloscope is used for time-domain interpretation of the input waveform. Whereas a spectrum analyzer is employed to interpret the frequency-domain of the RF waveforms.
Block Diagram
Before knowing how the device functions, let us know the spectrum analyzer block diagram and the functioning of each component.
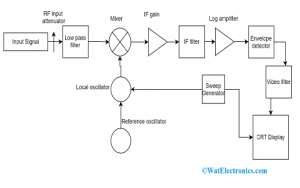
Spectrum Analyzer Block Diagram
The crucial component used in the construction of the analyzer is a swept-tuned receiver. The device consists of a mixer, detector, RF type attenuator, local oscillator a LED display section. Now, let us know the operation of each component.
RF Type Attenuator
This component is used for providing a required level of signal as input for the circuit. This attenuation takes place because when an increased range of broadband signals are applied there might be the chance of overloading, distortion, and gain reduction. So, attenuation provides a suitable level of an input signal to the system. The attenuation level is done automatically depending on the reference limit, and also manual setting is also possible. So, we can define RF attenuator as a protective device in the whole system.
LPF (Low Pass Filter)
An LPF restricts the flow of high-frequency range signals and allows only minimal level frequency signals. Including a low pass filter in the system will not allow out of the range signals for the next units of the system. This blocks the system from delivering unwanted signals. Few spectrum analyzers include pre-selector where this helps in blocking all the undesired frequency components and allows only preferred frequency component.
Mixer
There are mainly 3 ports in the mixer section. The mixer section functions as a frequency translator and transforms one kind of frequency into another form. The input signal and the output of the local oscillator signal are the mixer input signals. By combining these signals, the mixer provides the output signal. The frequency of the generated signal will be either the summation or difference of frequency levels of both the input and local oscillator signals.
Though, the variation between the two frequency ranges in intermediate frequency is used by the analyzer.
Intermediate Frequency Gain
This is the variable gain amplification device. This is utilized for correcting the signal’s vertical position showing no impact on the signal level of mixer input. This is constructed along with the input attenuator device in order to eliminate any difference in the reference limit with the modification in the input.
Intermediate Frequency Filter
This is the BPF which is pointed mainly at the intermediate frequency level. This is properly designed to allow only the necessary frequency level component. The bandwidth level of the IF is termed as the resolution bandwidth of the entire device. By minimizing the resolution bandwidth, there will be an increment in the selectivity and SNR. But there happens a decline in the speed of the sweep.
Detector
The functionality of the detector is that the intermediate frequency wave will be transformed into either video or baseband signal. This converted signal will get more digitized through the analog to digital converter and it is represented on the vertical axis of the display. In a single trace component, at the time of positive detection mode, the maximum value is taken into consideration and for negative mode, the minimum value is considered.
In order to find the noise component signals, generally, a normal detection mode also termed as rise and fall approach is employed. This happens the reason that when there is abrupt fall and rise levels in the signal, the detector considers this as noise and utilizes positive and negative detection one after the other. Though, a constant rise in the wave relates to the actual wave so that a positive peak detection approach is utilized.
Video Filter
This component functions as an intercessor in between the analog to digital converter and detector. This unit is generally termed LPF. It is utilized for smoothening the traces which are to be shown on the display. As it was already known that spectrum analyzer exhibits both the noise and signals on the display. So, when there is a higher level of noise, it is complicated to analyze the signal. Though, the variation in video bandwidth allows for the decline of peak-to-peak changes in the noise signal.
Local Oscillator
This is employed for analyzer tuning which is generally a voltage-regulated oscillator. This component is tuned through a sweep generator and with this frequency will be varied as per the ramp signal voltage levels. Including this, video signal also gets sampled by using ADC.
Spectrum Analyzer Working
At first, the input signal which has to be analyzed is given as input to the attenuator and this delivers the optimum signal to the mixer component. Here, the optimum and input signals are combined, and this generates an intermediate frequency signal. Additionally, the signal is fed as input to the IF filter and the delivered output is given to the detector and here the signal undergoes detection at the desired frequency level. The signal provided by the output displays the amplitude level and drives the vertical axis of the graph to be exhibited.
The relation between the local oscillator and sweep generator generates a frequency response. This leads to the generation of amplitude versus frequency graph at the display of the spectrum analyzer.
Types
There are mainly two types of spectrum analyzers where those are classified depending on the signal’s spectrum and those types are
Swept-Tuned Analyzer – This type utilizes a superheterodyne receiver in order to transform a section of the input signal to the middle frequency of the narrow BPF where the instant delivered power is exhibited with respect to time. By sweeping out the receiver’s middle-level frequency all through some range of frequencies, the output will also be frequency varied. Whereas when the sweep centers on any specific frequency level, it might be losing minimal time actions at other ranges of frequencies.
Fourier Transform Analyzer – This analyzer calculates the time-series of periodograms. This approach is mostly implemented along with the ADC and receiver. As discussed in the swept tuned analyzer, the receiver lessens the middle frequency of some fraction of the input spectrum, whereas the complete section will not be swept away. The main operation of the receiver is to minimize the sampling level so that it will be in sync with the analyzer. Having a suitable minimal sampling rate, these FT spectrum analyzers can handle the entire samples having a 100% duty cycle and because of this, any minimal duration events will not be skipped.
Advantages and Disadvantages
The advantages of spectrum analyzer are:
- Swept type analyzers can function up to some GHz range of frequency levels
- There will be a quick analysis of signals in the FT type of analyzer and also analyses every sample one by one. It also captures and analyzes phase data corresponding to the signal
- It is less expensive when compared with the oscilloscope
The disadvantages of spectrum analyzer are:
- Swept type of analyzers can analyze only continuous-wave signals without detecting any phase-related data
- Fourier transform analyzers can function only at a high range of frequencies because of restrictions on the sampling level of converters. Also, it has limitations on bandwidth
Applications of Spectrum Analyzer
The applications of spectrum analyzers include the following.
- Spectrum analyzers are sometimes useful in applications to calculate power levels and phase noise levels of the signals.
- Used for accepting electromagnetic interference and compatibility calculations
- Utilized in the applications to locate behavior and frequency of the signals when they impose any issues
- Used for the purposes of assessing RF shielding
- Employed in an examination of wireless transmitters
- Employed in telecommunication components
- Mobile communications
- Broadcasting devices
- Microwave communication systems
- Cable TV networks
- Radar systems
On the whole, this is a detailed explanation of Spectrum Analyzer. The article has provided information on Spectrum Analyzer working, block diagram, working, benefits & drawbacks, and uses. Get to know about what are the examples of spectrum analyzer and how it is used?